









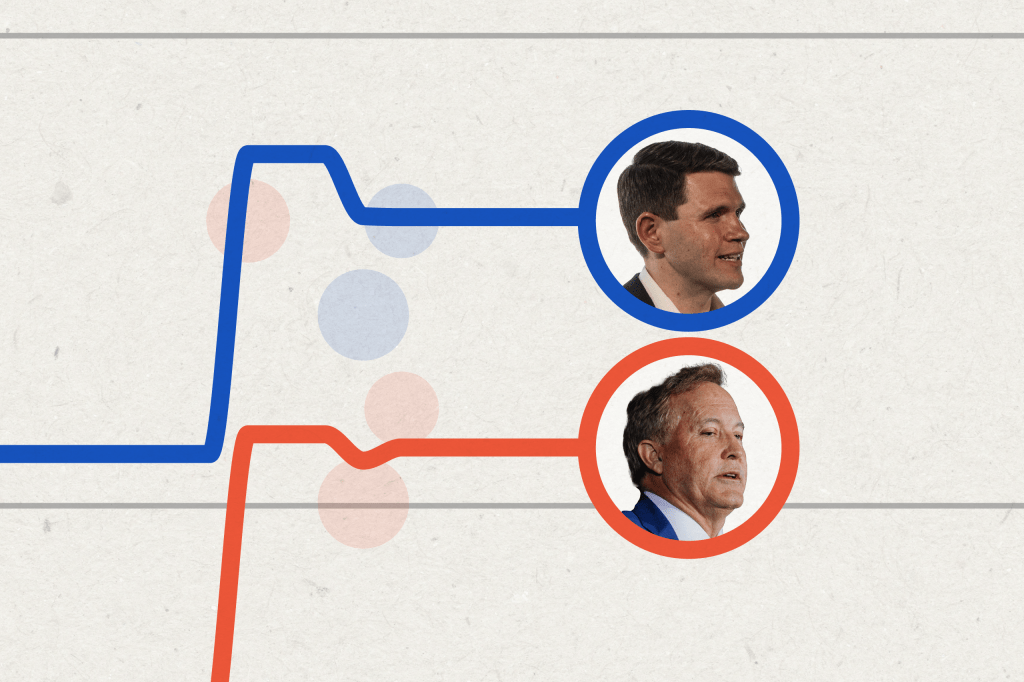
Recent polling indicates a tight race in the Texas U.S. Senate contest, with state Representative James Talarico, the Democratic candidate, slightly ahead of his Republican rival, Attorney General Ken Paxton, following the runoff election held on May 26.
Talarico’s recent polling numbers reflect a more favorable position than that of Democrat Beto O’Rourke in the 2018 election, where O’Rourke came close to unseating U.S. Senator Ted Cruz.
Understanding Polls
The reliability of polls can be assessed through various criteria, such as the historical accuracy of pollsters and the transparency of their methodologies. Here are some key factors to consider when interpreting poll results.
Partisan Sponsorship
Polls financed by candidates or political parties should be approached with caution, as noted by the American Association for Public Opinion Research. Nonpartisan organizations typically publish all their findings, while partisan polls might selectively release results that favor their sponsors.
Sample Size
Generally, larger sample sizes in election polling yield more dependable results. A broader sampling tends to capture a more accurate reflection of voter sentiment.
Sample Type
Election polls typically target three distinct groups: adults, registered voters, and those identified as “likely voters,” based on their past voting patterns and interest levels. While polls surveying adults can achieve larger sample sizes, they may not accurately represent the opinions of those who will actually cast their votes. During election cycles, polls focusing on registered voters are common due to their higher likelihood of participation.
As the election date approaches, surveys using “likely voter” samples are often deemed more indicative of actual voter turnout. Different polling organizations apply various methodologies to determine who qualifies as a likely voter, considering factors such as previous voting history and engagement with the current election.
Sampling Method
Pollsters typically utilize either probability or non-probability sampling techniques to select survey participants. Probability sampling ensures that every individual in the population has an equal chance of being chosen, while non-probability sampling, which may rely on internet panels or self-selected samples, lacks that assurance, leading to potential biases.
Despite probability sampling being the traditional standard, its increasing costs have prompted researchers to explore non-probability methods, which have sometimes yielded comparable, if not superior, results.
Margin of Error
Polls employing probability samples allow for the calculation of a margin of error, whereas non-probability polls cannot easily determine this metric and must instead rely on statistical models for estimates of sampling error.
Poll Tracker Methodology
The New York Times maintains a comprehensive database of election polls, and this tracker compiles data from its collection, calculating the average from polls conducted since Paxton’s Republican runoff victory in May.
Poll Inclusion Criteria
Every public poll that asked voters to choose between James Talarico and Ken Paxton, assuming the election were held that day, has been included in the average. Polls conducted prior to the May runoff are excluded from this average but remain available in a supplementary table.
Calculating the Average
The average poll results are weighted based on three factors: recency, sample size, and the partisan nature of the poll’s sponsorship. More recent polls are given greater weight as they are likely to reflect current public sentiment, while larger sample sizes are prioritized over smaller ones. Polls affiliated with political parties are counted at half the weight of non-partisan surveys.
Limitations of the Average
This average does not serve as a forecast for the election outcome. Early in the campaign, the limited number of available polls may cause significant fluctuations in averages with the introduction of new data, meaning that individual polls may carry more influence at this stage.