








The data visuals team in Texas has played a crucial role in creating around 100 impactful stories that illuminate the policy and political decisions influencing the lives of Texans. Their work has covered a wide range of topics, including the legislative session, the state’s water crisis, the July 4 floods, and essential education data releases.
Politics and Redistricting Tools
The year began with a highly charged legislative session. Senior developer Carla Astudillo contributed significantly by breaking down the anticipated votes for House speaker and the contentious debate surrounding major school voucher legislation. As the session concluded, the team diligently tracked key proposals and developed a resource that allowed readers to see how their local representatives voted on the most significant issues of the session.
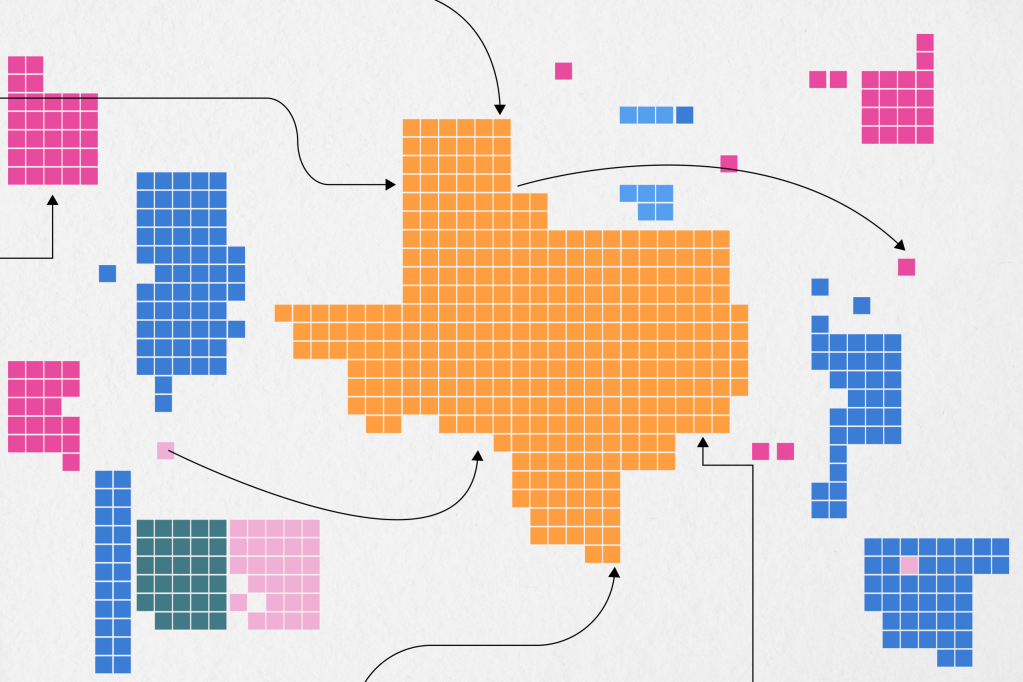
By summer, Texas politics faced a shift when state Republicans approved new U.S. House districts, a strategic move aimed at benefiting the GOP in Congress. Astudillo created an interactive tool enabling readers to enter their addresses and see how their congressional districts would change, complemented by maps and graphics illustrating the implications for both residents and elected officials.
School funding and the proposed voucher program emerged as intensely debated topics during the legislative session. To clarify these issues for readers, education data developer Rob Reid produced a funding explainer featuring clear visualizations that demystified complex terminology.
Public Education and Data Releases
Reid, alongside summer fellow Edison Wu, contributed to the coverage of significant education data releases that parents and schools rely on for evaluating student and campus performance. In April, the state released A-F ratings for the first time in five years, followed by updated figures in August.
Recently, new higher education outcomes data was released, tracking the long-term success of eighth-grade students who enrolled in Texas public schools a decade ago. Designer/developer Alex Ford created an interactive visualization demonstrating that socioeconomically disadvantaged students are more likely to drop out.
Health data reporter Dan Keemahill collaborated with local school boards and partnered with the Texas Tribune-ProPublica investigative team to explore how conservative special interest groups in Texas are leveraging at-large voting systems to influence educational content.
Public Health and Disease Outbreaks
This year, the team dedicated considerable effort to covering contagious diseases, marking the five-year anniversary of the COVID pandemic. Former designer/developer Yuriko Schumacher visualized the strong vaccine uptake among Hispanic Texans, which played a crucial role in saving lives. Additionally, she tracked the spread of measles across the state, while Keemahill analyzed long-term vaccination trends in Texas schools. At year’s end, Keemahill and the health team returned to West Texas to report on the local impact of the measles outbreak.
Other pressing public health concerns revolved around federal policies. Keemahill visualized how millions of Texans experienced cuts to their SNAP benefits following a federal government shutdown, disproportionately affecting the Rio Grande Valley. He and Wu also highlighted the significant increases in Affordable Care Act premiums, particularly impacting rural areas.
Water Shortages
As lawmakers debated the potential investment of billions into the state’s water system, Astudillo and Schumacher collaborated with reporters from regional teams to delve into the state’s impending water crisis. Their work included a visual explainer and an interactive tool allowing readers to assess the severity of expected shortages and ways to get involved. Schumacher also reported on declining groundwater levels, while Astudillo visualized potential desalination solutions to address the water crisis.
A Devastating Flood
This summer, Kerrville and surrounding areas experienced catastrophic flooding that claimed the lives of at least 135 individuals. Wu illustrated the nearly 20 camps clustered around the Guadalupe River affected by the flooding and depicted the historical severity of the July 4 floods.
Undocumented Coverage and ICE Arrests
The team also produced a variety of immigration-focused stories throughout the year. Early on, Schumacher created charts detailing the nearly 2 million undocumented Texans and the stagnation of this population over time. In the summer, Ford and Wu assisted in covering the deportation case of a Houston mother, producing a diagram to illustrate its impact on her family.
In November, Astudillo analyzed federal data for a piece documenting the sharp rise in U.S. Immigration and Customs Enforcement arrests during President Donald Trump’s administration. She created various charts, including one showing that an increasing number of those arrested had no prior criminal convictions.